“The wealth of nations in the face of climate change”


How can we explain the differences in prosperity around the world? Should we attribute them to geography, through the differences between countries in terms of natural resources, disease vectors, climatic conditions? Or to institutions, through respect for property rights, the rule of law, and the provision of incentives and opportunities for investment? Should we agree with Montesquieu (1748), who saw in the ascendancy of climate over the character of men “the first of all empires”, or with Voltaire (1756), for whom government “exerts a hundred times more influence” on societies than climate?
To explain GDP per capita, let’s take, for example, distance from the Equator to embody geography on the one hand, and the composite governance indicator developed by the World Bank, which reflects the quality of national institutions, on the other. Governance seems to win out hands down, according to Harvard’s Dani Rodrik and his colleagues.
But there’s more to the issue than this binary alternative, as geography influences the quality of institutions. In this case, climate shocks have been shown to increase the number and intensity of conflicts and political instability. A recent study shows, for example, that a rise of one degree Celsius increases the probability of a coup d’état by almost 5%. As this instability discourages investment and therefore long-term growth, temperature has both a direct and an indirect effect, mediated by institutions.
The major difference between these direct and indirect effects is their time horizon. The direct effect is immediately apparent, since it takes the form of a reduction in labor productivity, a drop in agricultural yields or other weather-dependent activities, or the alteration or even destruction of the infrastructure needed for production. The indirect effect is more gradual, as it proceeds in two stages: the response of institutions to a climatic shock, then the economic manifestation of institutional evolutions.
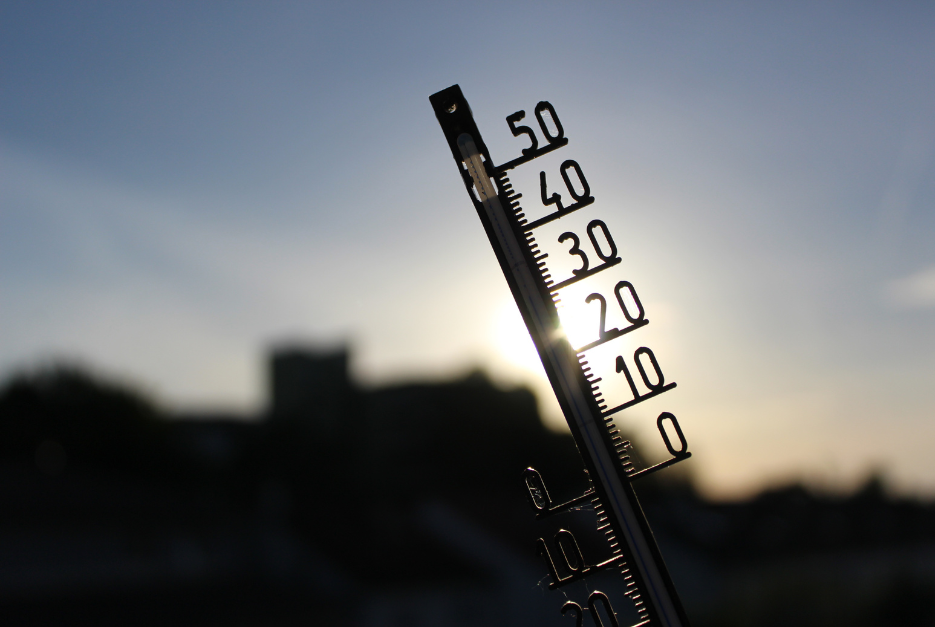
Economic research on short-term effects is now well established, and the benchmark study was published in Nature in 2015. Its principle is based on a comparison of year-on-year changes in production and annual temperature in the same country, using economic and climatic data from 1960 to 2010 on 166 countries. All other things being equal, in particular the quality of the country’s institutions, the authors identify a “bell-shaped” relationship, with GDP per capita rising with temperature until it reaches 13°C, then falling again. They also show that GDP per capita declines increasingly rapidly above this optimum temperature. In other words, one degree more in India, where the average annual temperature is 27°C, does more damage than in France, where the average temperature is around 14°C.
This difference can be explained by the agricultural sector, which accounts for a larger share of economic activity in warmer – and poorer – countries. And a temperature rise of more than twenty degrees quickly reduces the sector’s productivity.
Extrapolating these short-term effects to the long term is a tricky business, as it involves estimating two dimensions: the level of indirect effects and the time it takes for them to manifest themselves. Another complexity is that their sign is uncertain. They can reinforce the total effect when climate shocks cause lasting damage to production infrastructures or the pace of learning, particularly in schools, when they cause lasting soil degradation or deplete water tables, or when they destabilize institutions. On the contrary, they can mitigate them, by accelerating adaptation or triggering Keynesian-type stimulus shocks linked to the repair of climatic damage. For example, the years following the destruction of a hurricane generally see a rebound in growth induced by the reconstruction of infrastructure or buildings.
There are several econometric methods for dealing with this problem. The most obvious is to estimate not only the effect of a climatic shock on economic activity in the year in which it occurs, but also in subsequent years. Another approach is not to use inter-annual meteorological variations, but longer-term variations over a decade, for example: the assumption here is that a ten-year interval leaves sufficient time for indirect effects to manifest themselves. Or measure the effect of shocks on economic growth rather than on the level of wealth. The results obtained so far suggest that the positive delayed effects offset their negative effects. The total effect of climate shocks would then be no different from their direct short-term effect.
Ultimately, global warming is likely to have a far greater impact on the economic development of the least developed countries, because they are warmer. Some of the most serious estimates point to a drop in GDP of over 75% in 2100 for the poorest countries for a temperature rise of around 4°C, according to the IPCC’s pessimistic scenario.
Montesquieu and Voltaire based their ideas on maps, history books and their travels. They could not rely on the myriad of global demographic and climatic data available to us today. As we saw in Chapter 1, we now know how the population is distributed across the globe and are able to project its growth. One percent of the world’s population lives where the average annual temperature exceeds 29°C, a threshold considered to make human life difficult to bear. Assuming global warming of 2.7°C, this proportion would rise to 23% by 2100. Including: 600 million Indians, 300 million Nigerians and 100 million Indonesians. In addition to these top positions, the next forty-seven countries do not include any OECD countries, and only three high-income countries, all oil producers.
In a ranking of population at risk of flooding, only two OECD countries, the USA and Japan, feature in the top ten in terms of number of residents at risk. Once again, India tops the list. These and other data illustrate a fact well known to experts: rich, long-established industrialized countries are relatively spared the consequences of global warming, while countries struggling to develop combine high population growth, excessive exposure to climate disruption and limited financial capacity to reduce its impact.
Economic inequality between countries has declined over the past half-century, but this welcome reversal would have been even more marked without global warming. This is the thesis put forward by an economist and an environmental specialist, both from Stanford University. The title of their article, published in the official journal of the American Academy of Sciences, makes no secret of the fact: Global warming has increased global economic inequality. In it, they establish that the wealth gap between the inhabitants of the richest and poorest countries would have been reduced by almost half had it not been for the rise in temperature observed between 1960 and 2010.
Of course, inequality is not simply a matter of GDP. Global warming also has an inequitable impact on mortality, once again widening the gap between rich and poor countries.
The last thirty years provide a first indication of this. Heat-related mortality attributable to rising temperatures since 1990 has been estimated at 0.58% of total mortality on average for some forty countries. But this ratio is three times higher for Vietnam, and twice as high for Iran and Thailand. In contrast, it is twice as low for the United States and the United Kingdom.
The gap is set to widen in the future, as the elastic band is stretched at both ends: temperature-related mortality falls in richer, colder countries, while it rises in poorer, warmer ones. In Chapter 1, we mentioned a modeling study that estimated the additional mortality associated with a 2.7°C rise in temperature at 11 deaths per 100,000 inhabitants by 2100. Behind this mortality rate for all countries combined, we find Pakistan at one extreme with a rate of 81.4 and Europe at the other with a rate of -42. Yes, a negative rate. This model takes into account mortality linked to both hot and cold temperatures. It predicts that in Europe, the deaths avoided by milder winters outweigh the extra deaths from hotter summers. As we saw in chapter 1, the relationship between temperature and mortality is not a one-way street. Warming also reduces the number of very cold days and peaks.
This growing inequality in mortality is confirmed by work carried out by another team of researchers. This time, the model focuses on the excess mortality linked to temperature trends over the last twenty years of our century. This would lead to a 1.8% increase in total global mortality, assuming a rise of 2.7°C (IPCC RCP 4.5 scenario). Behind this average, however, we find an increase of 9.7% for Niger, 6.2% for Pakistan and a drop of 3.3% for Ireland, and even 5.4% for Iceland. France is almost in balance, with a modest 0.4% increase.
Finally, we should mention the growing inequality between rich and poor countries in terms of morbidity linked to infectious diseases. It is now well established that global warming increases the ease of transmission of parasites, such as the one that causes malaria, and viruses, such as chikungunya, dengue and Zika.
The library invites you to meet Matthieu Glachant and François Lévêque for a discussion on their book Survivre à la chaleur.


Faced with the acceleration of climate disruption and its already visible impacts – deadly heat waves, floods, giant fires, the weakening of agricultu...